Citizen-generated data (CGD) expands what gets measured, how, and for what purpose. CGD initiatives cover areas from cartography to government policies, public services, or environmental research. As the collection and engagement with CGD rises in relevance and visibility, public institutions can learn from existing initiatives about what CGD initiatives do, how they enable different forms of sense-making, and how this may further progress around the Sustainable Development Goals (SDGs).
This report examines different approaches to doing and organizing CGD, as well as how governments already engage with these types of initiatives. It identifies several concrete benefits for implementing and monitoring the SDGs, underlining the importance for public institutions to further support these initiatives.
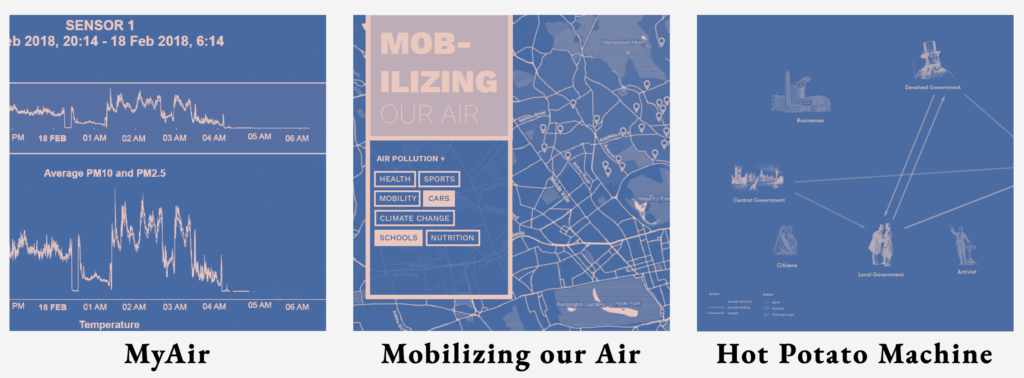
Supported by OrganiCity and developed by the Public Data Lab, SaveOurAir is an exploration of the social and political aspects of “smart cities”. Its specificity is the effort to use digital data to stir (rather than settle) urban debate and to nurture (rather than purify) their multiple attachments.
Focussing on air quality, SaveOurAir explored three ways to make urban data more “local” and “politically relevant” and developed three experiments in data activation.
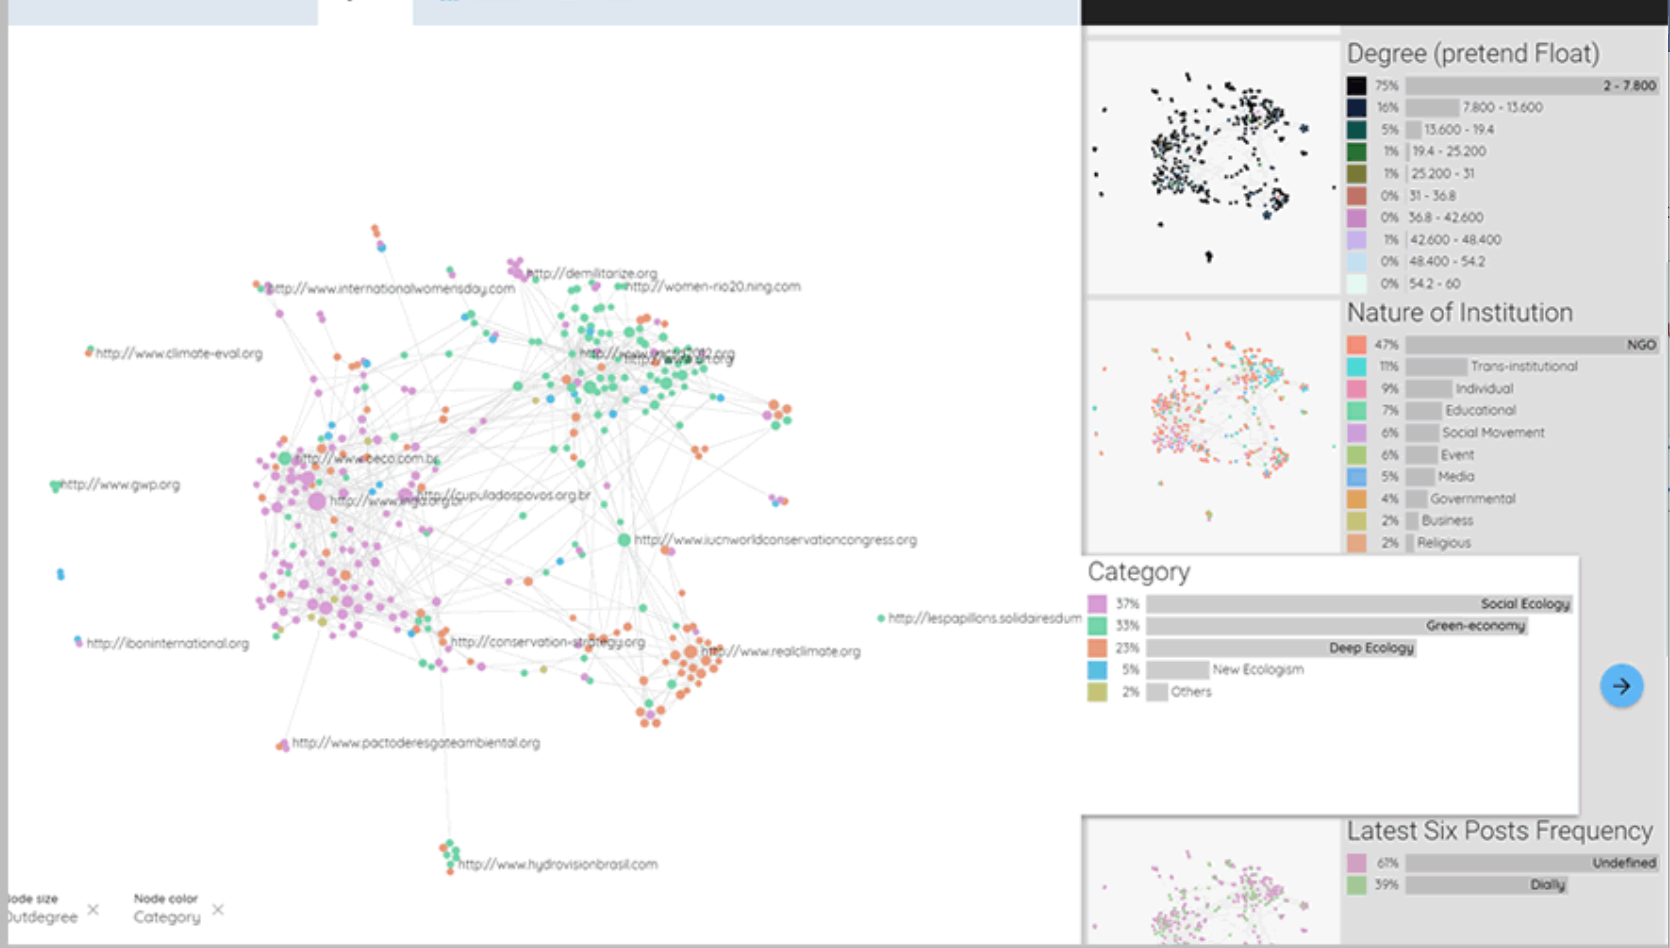
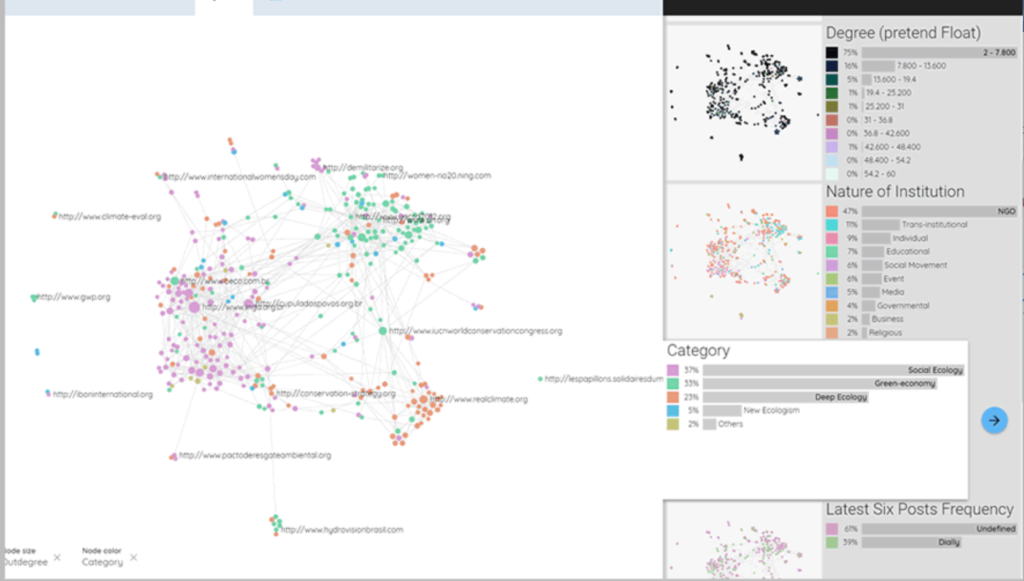
Networks are increasingly popular in the social sciences and in the humanities as interfaces for exploratory data analysis. “Visual Networks Analysis” (or VNA) allows scholars to analyse large relational datasets without having to deal with the full complexity of graph mathematics.
Current VNA tools, however, are either too complicated or unable to handle large datasets. Hence MiniVAN, a VNA tool, accessible to scholars with little knowledge of mathematics or coding and yet capable to scale up to graphs of several thousands of nodes.
MiniVAN is a project of the Public Data Lab with support from Sage Ocean Concept Grant. MiniVAN is currently under development and will be released in early 2019. Stay tuned!
Contact
Please direct any inquires about this project to the miniVAN team (Mathieu Jacomy, Guillaume Plique, Jonathan Gray, Tommaso Venturini and Axel Meunier) at contact at publicdatalab.org.
About
MiniVAN is a tool for the exploration of small and large networks, addressed to social scientists and everyone who is interested in graph analysis but has difficulties with graph mathematics. The challenge is to make sophisticated analytic techniques (clustering, spatializing, ranking, filtering, etc) available in a visual and user-friendly environment.
MiniVAN has several advantages over the existing software, but it’s key strength is a long-standing reflection on the conceptual basis of Visual Network Analysis. MiniVAN will not only offer a collection of analytic functions, but also guide it users aligning different visualisations and metrics in a ordered inquiry.
The development of MiniVAN will be uphold by a series of discussions with potential alpha-users, through the support of the Public Data Lab a research network on digital data and public interventions. The PLD gathers scholars coming from many leading digital methods centres from across Europe (both from the social and the information sciences). It also entertains a network of contacts with practitioners, journalists, civil society groups, designers, developers and public institutions, which will be mobilised to specify the different needs that MiniVAN will try to respond to.
MiniVAN is composed of two distinct open source web applications:
The Analyser
Receives and parses a graph uploaded by the user;
Guides the user through the choice of the dimensions and the methods of the analysis;
Accompanies the user in the definition of the visual properties of the graph representation;
Produces a file bundle to be processed by the second application. (The file bundle produced by the Analyser can be hosted by any web server or by a third-party solutions – such as Github’s gists)
The Visualiser
Reads the data contained in the file bundle produced by the Analyser;
Displays multiple visualizations of the network;
Provides selected metrics and information about categories and relational structures;
Allows the proposed views to be further filtered/tweaked/explored etc. by the readers;
Generate a code snippet that can be embedded in any website.
Venturini, Tommaso, Mathieu Jacomy, Liliana Bounegru, and Jonathan Gray. 2018. “Visual Network Exploration for Data Journalists”. In The Routledge Handbook to Developments in Digital Journalism Studies, edited by Scott II Eldridge and Bob Franklin. Abingdon: Routledge.
A Field Guide to “Fake News” and Other Information Disorders explores the use of digital methods to study false viral news, political memes, trolling practices and their social life online.
It responds to an increasing demand for understanding the interplay between digital platforms, misleading information, propaganda and viral content practices, and their influence on politics and public life in democratic societies.
It is released under a Creative Commons Attribution license to encourage readers to freely copy, translate, redistribute and reuse the book. All the assets necessary to translate and publish the guide in other languages are available on the Public Data Lab’s GitHub page.